


Using the interface
OpenSesame has a powerful graphical interface that consists of several components (Figure 1).
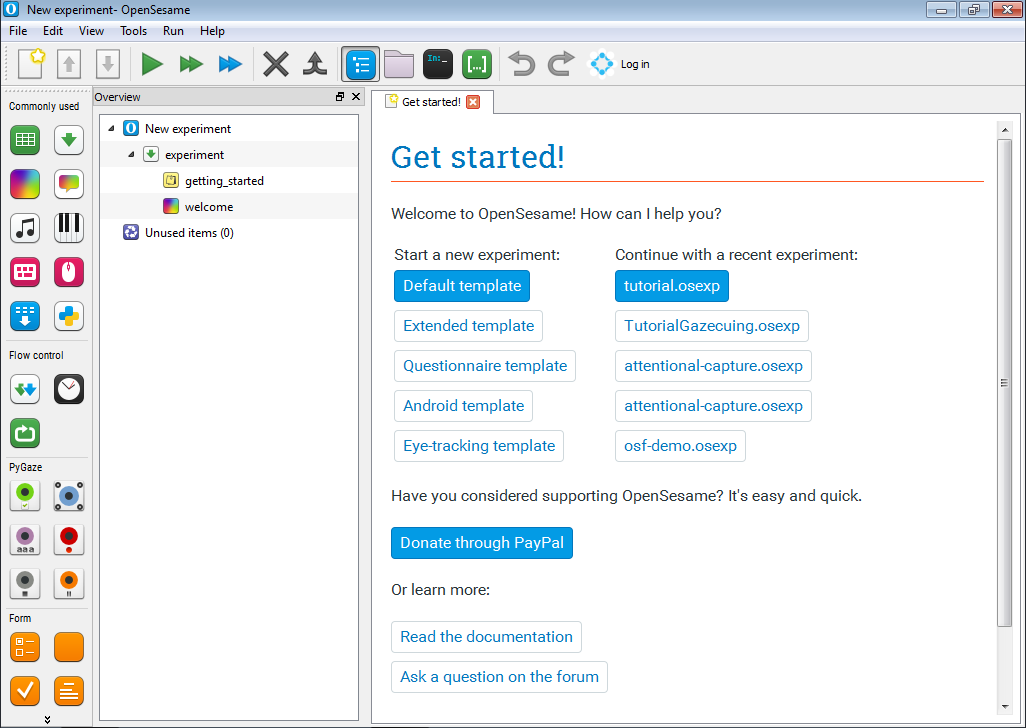
Figure 1. The OpenSesame user interface.
Toolbars and menubar
The menubar
The menubar (Figure 2) is shown at the top of the window, or, on some operating systems, is integrated into the border around the window. The menubar contains general functionality, such as saving and opening experiments, running experiments, etc.

Figure 2. The menubar.
The main toolbar
The main toolbar (Figure 3) is (by default) shown at the top of the window, just below the menubar. The main toolbar contains a selection of the most relevant functionality from the menubar.

Figure 3. The main toolbar.
The item toolbar
The item toolbar (Figure 4) is (by default) shown at the left of the window. The item toolbar contains all items, that is, all building blocks of an experiment. You can add items to your experiment by dragging them from the item toolbar into the overview area.
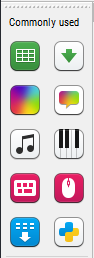
Figure 4. The item toolbar.
The tab area
The tab area is the central part of the window (Figure 5). The tab area is where item controls, documentation, important messages, etc. are shown. The tab area can contain multiple tabs, and functions much like a tabbed web browser.
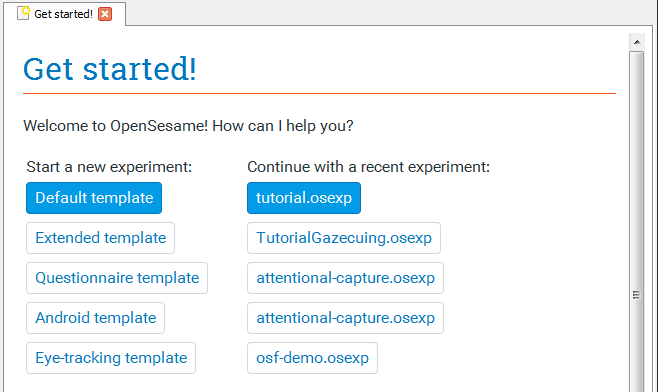
Figure 5. The tab area.
The overview area
The overview area (Figure 6) is (by default) shown at the left of the window, to the right of the item toolbar. The overview area shows the structure of your experiment as a tree. You can re-order the items in your experiment by dragging them from one position to another in the overview area.
- Shortcut to hide/ show:
Ctrl+\
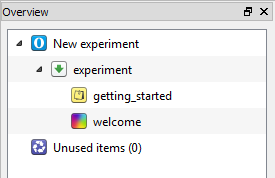
Figure 6. The overview area.
The file pool
The file pool (Figure 7) is (by default) shown at the right of the window. It provides an overview of all files that are bundled with the experiment.
- Shortcut to hide/ show:
Ctrl+P
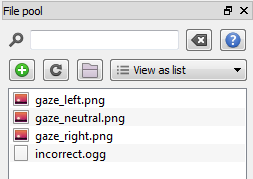
Figure 7. The file pool.
The debug window
The debug window (Figure 8) is (by default) shown at the bottom of the window. It provides an IPython interpreter, and is used as the standard output while an experiment is running. That is, if you use the Python print() function, the result will be printed to the debug window.
- Shortcut to hide/ show:
Ctrl+D
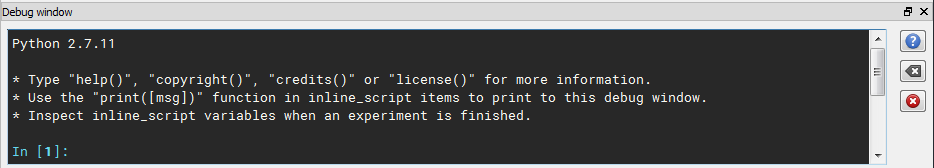
Figure 8. The debug window.
The variable inspector
The variable inspector (Figure 9) is (by default) shown at the right of the window. It provides a list of all variables that are detected in your experiment. When you are running an experiment, the variable inspector also provides a real-time overview of variables and their values.
- Shortcut to hide/ show:
Ctrl+I
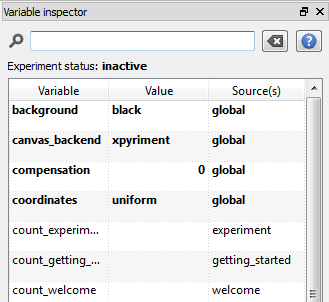
Figure 9. The variable inspector.
Keyboard shortcuts
The keyboard shortcuts listed below are default values, and can be changed as described under Changing shortcuts.
General shortcuts
The following keyboard shortcuts are available everywhere:
- Quick switcher:
Ctrl+Space - New experiment:
Ctrl+N - Open experiment:
Ctrl+O - Save experiment:
Ctrl+S - Save experiment as:
Ctrl+Shift+S - Undo:
Ctrl+Alt+Z - Redo:
Ctrl+Alt+Shift+Z - Run experiment fullscreen:
Ctrl+R - Run experiment in window:
Ctrl+W - Quick-run experiment:
Ctrl+Shift+W - Show/ hide overview area:
Ctrl+\ - Show/ hide debug window:
Ctrl+D - Show/ hide file pool:
Ctrl+P - Show/ hide variable inspector:
Ctrl+I - Focus overview area:
Ctrl+1 - Focus tab area:
Ctrl+2 - Focus debug window:
Ctrl+3 - Focus file pool:
Ctrl+4 - Focus variable inspector:
Ctrl+5
Editor shortcuts
The following keyboard shortcuts are available in editor components, such as the inline_script:
- Run selected code in debug window (if applicable):
Alt+R - Run all code in debug window (if applicable):
Shift+Alt+R - Comment selected line(s):
Ctrl+M - Uncomment selected line(s):
Ctrl+Shift+M - Show find/ replace dialog:
Ctrl+F - Hide find/ replace dialog:
Escape - Show/ hide preferences:
Ctrl+Shift+P - Next tab (if applicable):
Alt+Left - Previous tab (if applicable):
Alt+Right - Undo:
Ctrl+Z - Redo:
Ctrl+Shift+Z - Copy:
Ctrl+C - Cut:
Ctrl+X - Paste:
Ctrl+V
Tab-area shortcuts
The following keyboard shortcuts are available in the tab area:
- Next tab:
Ctrl+Tab - Previous tab:
Ctrl+Shift+Tab - Close other tabs:
Ctrl+T - Close all tabs:
Ctrl+Shift+T - Close current tab:
Alt+T
Overview-area and sequence shortcuts
The following keyboard shortcuts are available in the overview area and the sequence item:
- Context menu:
+ - Copy item:
Ctrl+C - Paste item:
Ctrl+V - Delete item:
Del - Permanently delete item:
Shift+Del - Create linked copy:
Ctrl+Shift+L - Create unlinked copy:
Ctrl+Shift+U - Rename:
F2 - Change run-if statement (if applicable):
F3
Changing shortcuts
Currently, you can change most keyboard shortcuts only through the cfg object in the debug window. First, get a list of configuration options by typing:
print(cfg)
Locate the name of the shortcut that you want change, such as qProgEditRunSelectedShortcut. Next, change it by typing:
cfg.qProgEditRunSelectedShortcut = 'Ctrl+Shift+E'
Finally, restart OpenSesame for the new shortcuts to take effect.