


Debugging
While designing a new experiment, you will inevitably encounter bugs. Bugs can manifest as crashes accompanied by error messages, or as unexpected behaviors without any explicit error message.
Debugging, the art and skill of diagnosing and rectifying these errors and unanticipated behaviors, is a critical part of the experimental design process.
Debugging in the user interface
Using the variable inspector
The Variable Inspector in OpenSesame provides an overview of all variables that are currently active within your experiment. This includes:
- Variables explicitly defined in the user interface, typically in a loop item.
- Response variables, which are set by various response items such as a keyboard_response item.
- Variables that are defined using Python inline_script items.
When an experiment is running, the Variable Inspector dynamically updates, providing a live overview of variables and their values. This feature allows you to monitor the behavior of your experiment in real-time, assisting you in identifying any potential issues or bugs.
For example, consider a situation where you have defined a variable left_letter to define which letter should appearing on the left side of a sketchpad. However, during execution, you notice a mismatch in the Variable Inspector: left_letter is actually being shown on the right side of your display. This is indicates a bug such that you have misplaced the right and left letters on the sketchpad.
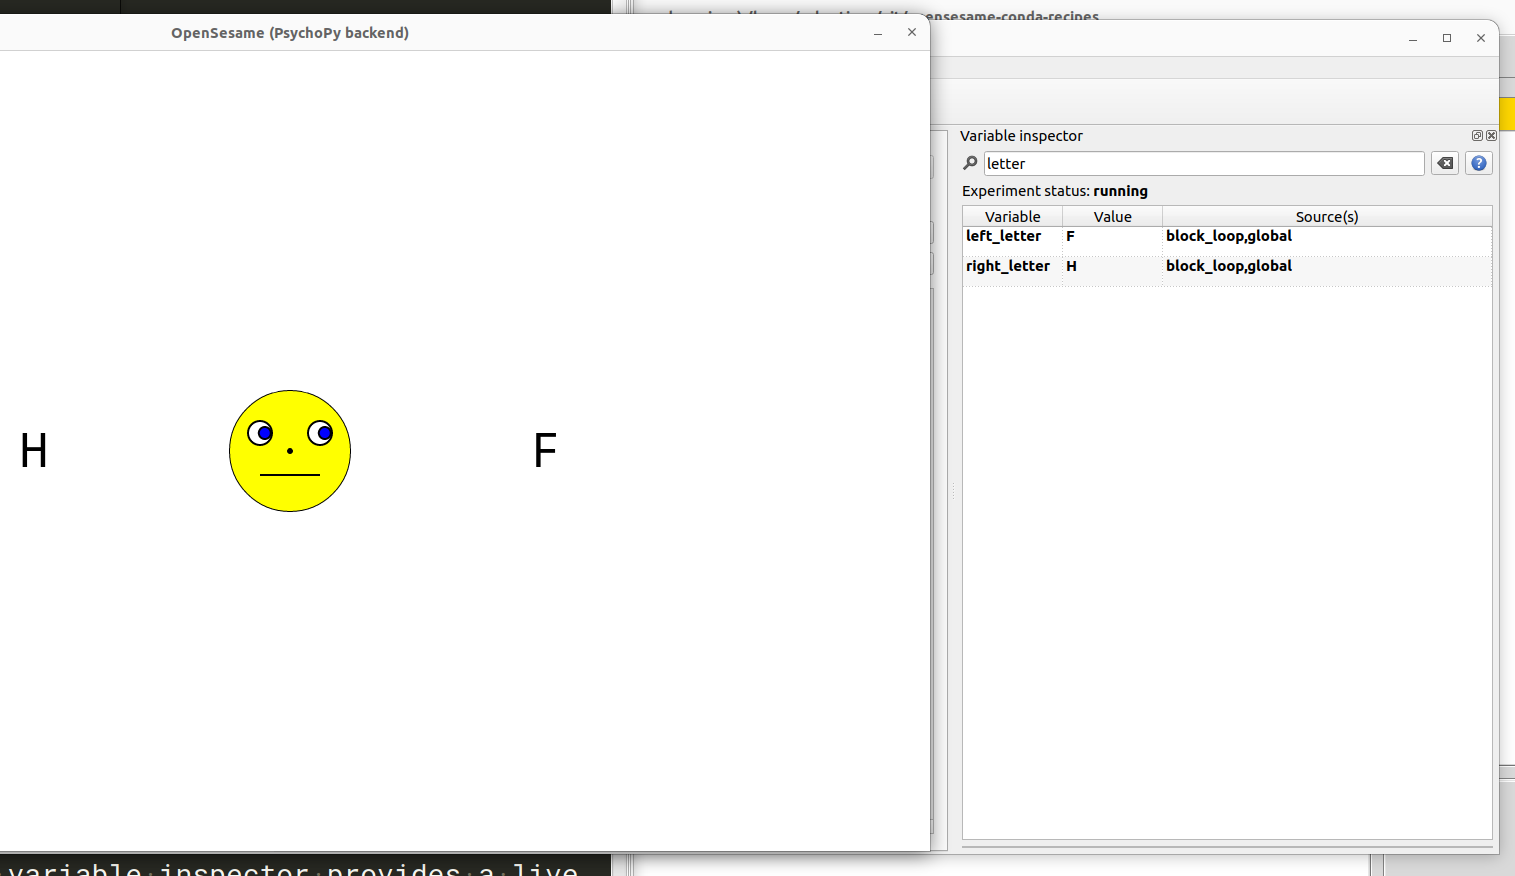
Figure 1. You can use the variable inspector to check whether your experiment behaves as it should. In this example, there is a bug such that the letter that is defined through the variable left_letter actually appears on the right and vice versa.
Using the Variable Inspector regularly to monitor variables helps ensure that your experiment is behaving as expected and aids in identifying problems early on.
Printing debug messages to the IPython/ Jupyter console
The Python print() function is a simple-yet-powerful debugging tool when used inside inline_script items, and serves a similar purpose to the Variable Inspector. For instance, you can print the values of the variables left_letter and right_letter during the Prepare phase of an inline_script at the beginning of each trial.
To view these debug messages, open the Jupyter/ IPython console and monitor the output while running the experiment. By doing so, you can verify whether the output displayed in the console aligns with the experiment's actual behavior.
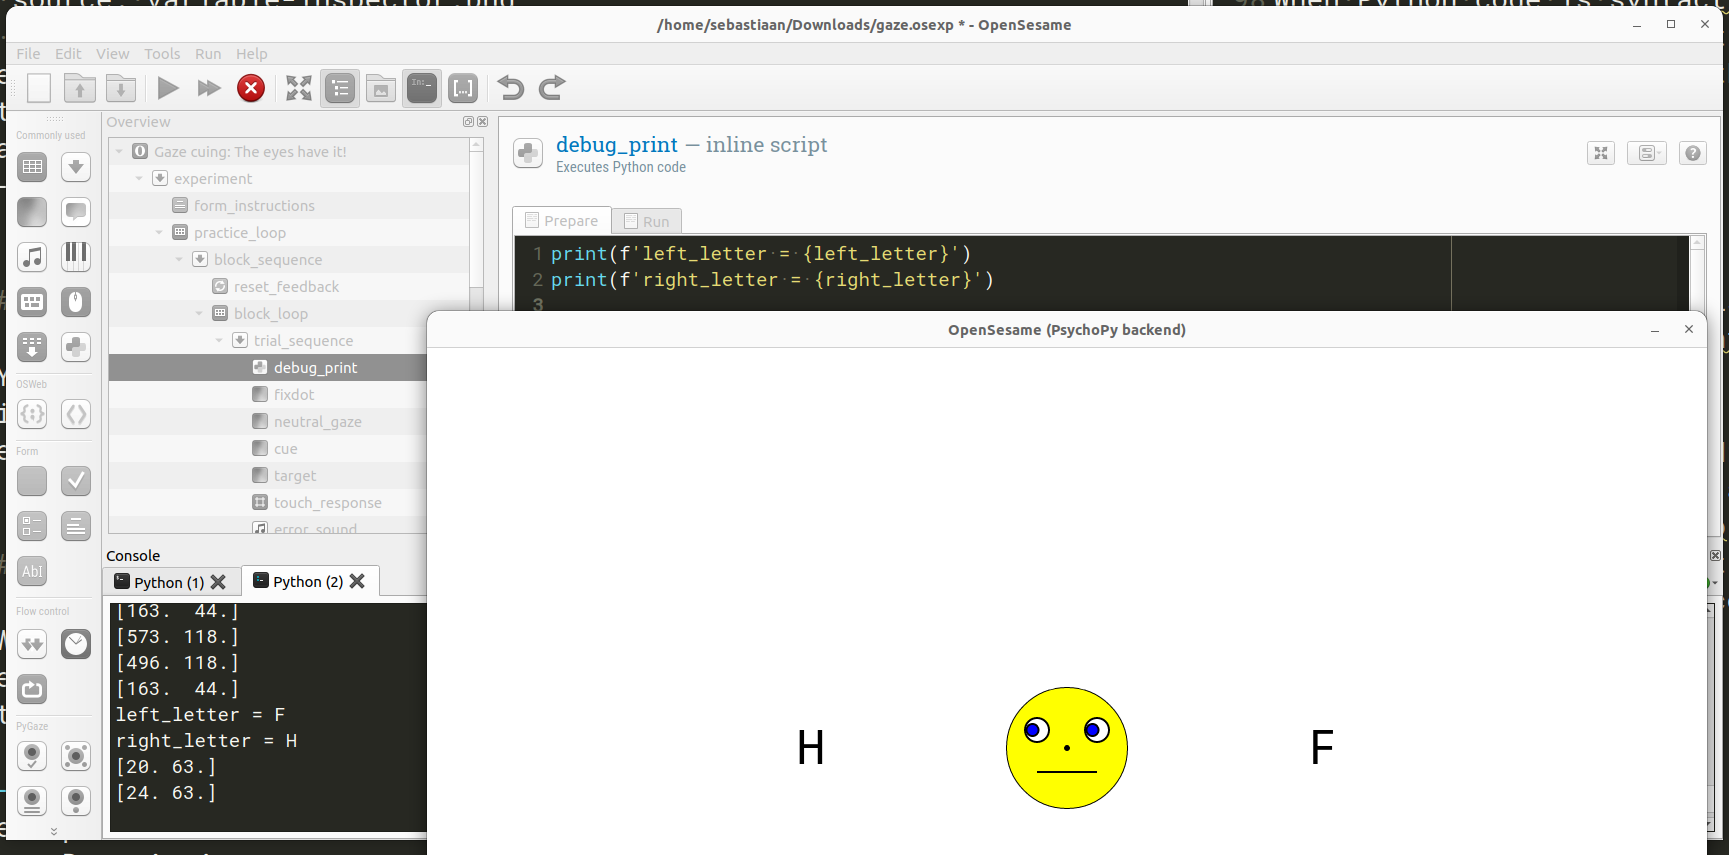
Figure 2. The Python print() function can be used to output debug messages to the console.
In the above example, it becomes evident that the letter assigned to the left_letter variable (hence expected to appear on the left) is actually appearing on the right, and vice versa.
Interpreting user-interface error messages
When a bug in your experiment causes a crash, OpenSesame displays an error message, also referred to as an 'Exception'. An error message typically consists of the following components:
- Error type: Indicates the general class of error. In the example below this is an
FStringError. - Description: Provides a more specific explanation of what triggered the error. In this case, 'Failed to evaluate …'.
- Source: Specifies the item that triggered the error and whether it occurred during the Run or Prepare phase.
- Traceback: A detailed Python error message. This information is only shown if the error occurred while evaluating custom Python code, which includes inline_script items, but also conditional expressions (e.g. run-if expressions), and text with embedded variable references.
- Learn more about this error: An interactive button you can click to get more detailed information about the error message.
Let's look at an example to better understand these components and learn how to fix a common error:
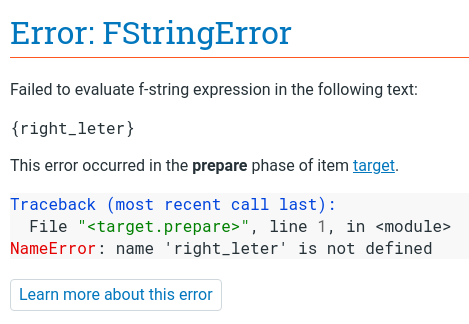
Figure 3. An FStringError indicates an issue when trying to evaluate a text string containing a Python expression.
This is an FStringError, which means there was an issue while interpreting a text string that includes a Python expression. In this example, the problematic text is {right_leter}. Anything enclosed within curly braces is interpreted as a Python expression, and therefore in this case the Python expression is right_leter—which is simply a variable name. Trying to evaluate the Python expression right_leter triggered a NameError because right_leter is not defined.
That's pretty technical, but what exactly went wrong here in simple terms? The issue arises from referring to a non-existent variable: right_leter. Looking at the variable name, it seems likely that there's a typo: the intended variable is likely right_letter, with a double 't'.
Where should we correct this mistake? The error message indicates that the source of the error is an item called target, which is a sketchpad. To resolve the error, we need to open target and change the text from '{right_leter}' to '{right_letter}'.
Interpreting Python error messages
In Python, errors fall into two categories: syntax errors and exceptions (or runtime errors).
Python syntax errors
A syntax error occurs when the Python interpreter cannot parse code because it violates Python's syntax rules. This could be due to mismatched parentheses, missing commas, incorrect indentation, and so on. In OpenSesame, this results in a PythonSyntaxError.
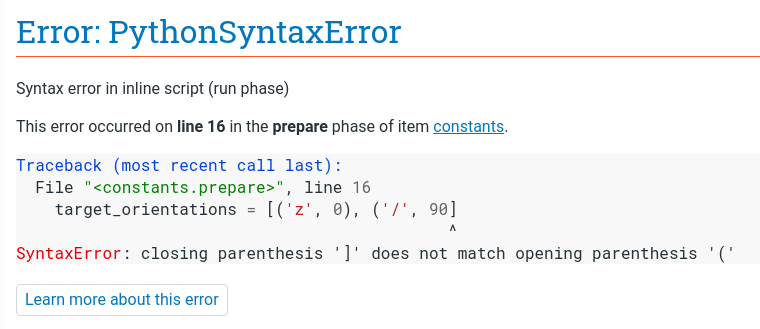
Figure 4. A PythonSyntaxError is triggered when the code violates Python's syntax rules and cannot be parsed.
The error message above indicates that a syntax error has occurred on line 16 of the Prepare phase of an item named constants. Here's the problematic line:
target_orientations = [('z', 0), ('/', 90]
The message also hints at mismatched parentheses as the potential source of the error. Taking that into consideration, we can fix the issue by adding a missing parenthesis ) before the closing bracket ]:
target_orientations = [('z', 0), ('/', 90)]
Python Exceptions
When Python code is syntactically correct but encounters a problem during execution, an exception is raised. In OpenSesame, such exceptions result in a PythonError.
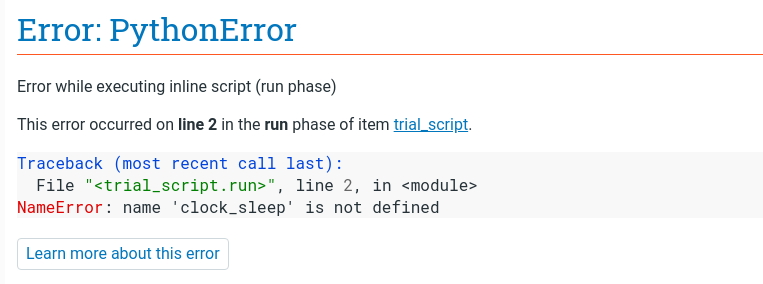
Figure 5. A PythonError is triggered when an exception is raised during the execution of syntactically correct Python code.
The error message above indicates that a NameError was raised on line 2 of the Run phase of an item named trial_script. Specifically, the identifier 'clock_sleep' is not recognized. Looking at the error-causing line, it's apparent that we've used an underscore (_) instead of a dot (.), incorrectly implying that clock_sleep() is a function.
clock_sleep(495)
To rectify this, we should correctly reference the sleep() function as part of the clock object:
clock.sleep(495)
Debugging in a web browser (OSWeb)
Printing output to the browser console
The JavaScript console.log() function is a simple-yet-powerful debugging tool when used inside inline_javascript items. It serves a similar purpose to the Python print() function and the Variable Inspector, neither of which are available in OSWeb. For instance, you can print the values of the variables left_letter and right_letter during the Prepare phase of an inline_script at the beginning of each trial.
To view these debug messages, you need to open the browser console. Here's how to do it in Chrome, Firefox, and Edge:
- Google Chrome: Press Ctrl + Shift + J (Windows / Linux) or Cmd + Option + J (Mac).
- Mozilla Firefox: Press Ctrl + Shift + K (Windows / Linux) or Cmd + Option + K (Mac).
- Microsoft Edge: Press F12 to open the developer tools, then select the "Console" tab.
Once the console is open, you can monitor the output while running the experiment, allowing you to check whether the output displayed in the console aligns with the experiment's actual behavior.
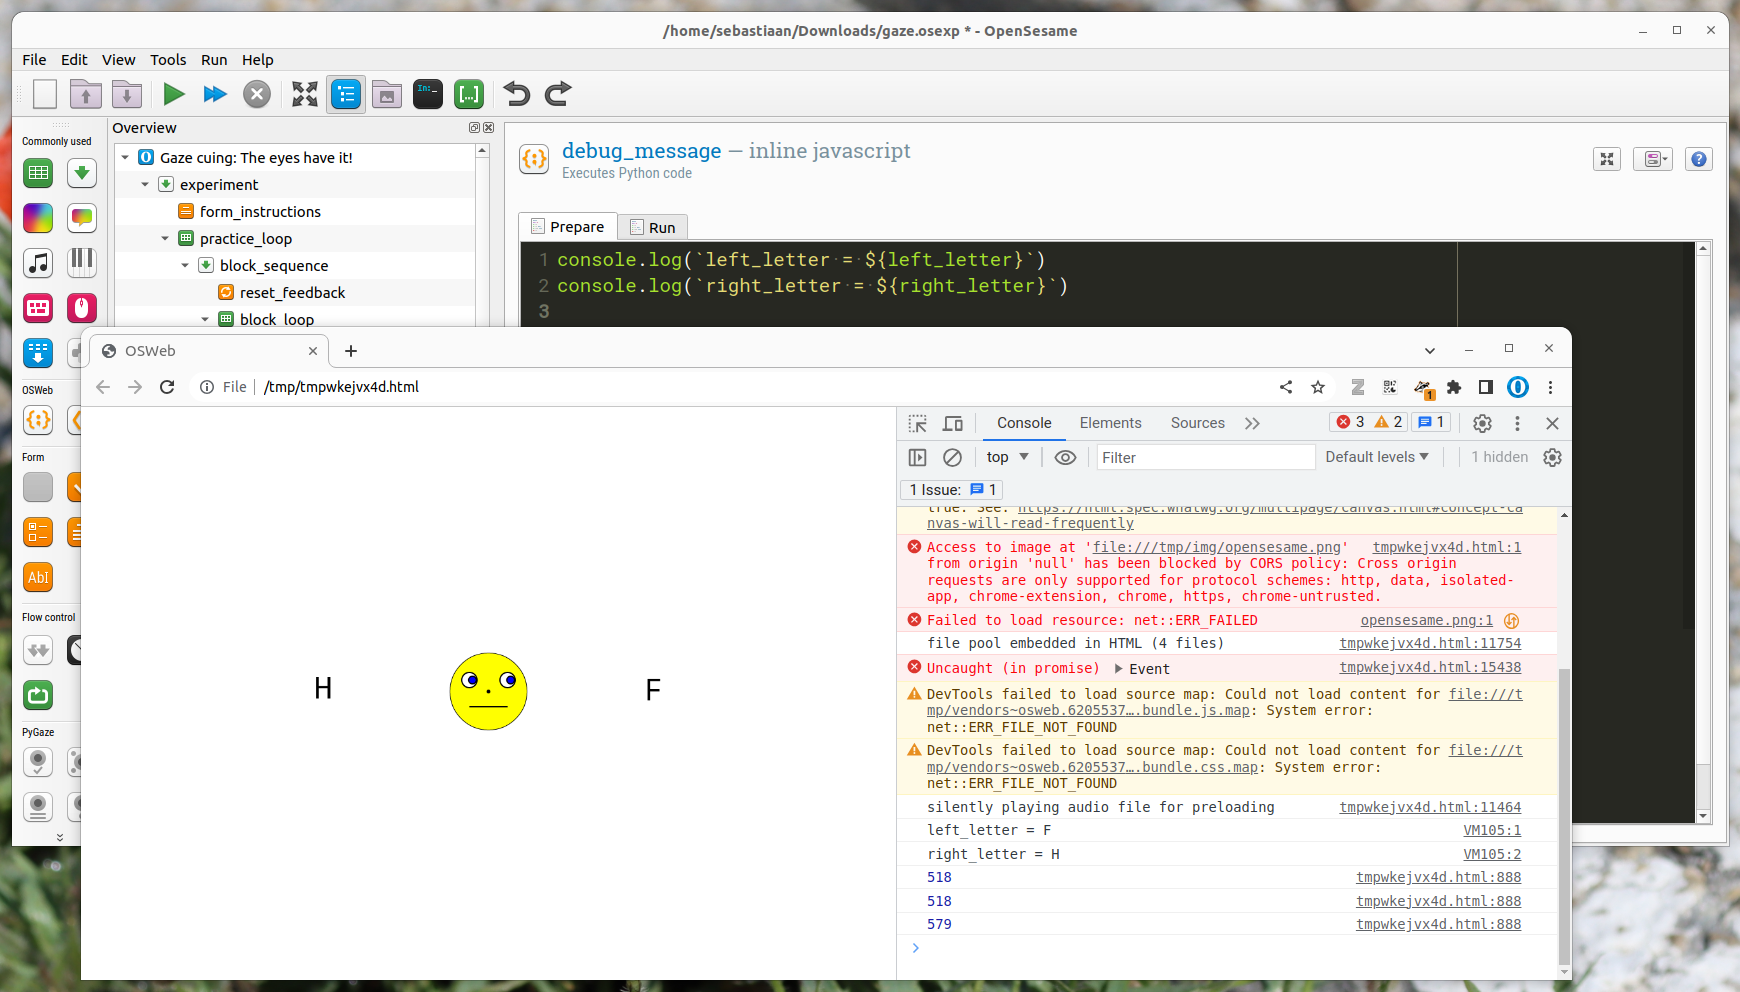
Figure 6. The JavaScript console.log() function can be used to output debug messages to the browser console.
In the above example, it becomes evident that the letter assigned to the left_letter variable (which should appear on the left) is actually appearing on the right, and vice versa.
Understanding error messages
When your browser-based experiment crashes, OSWeb will show an error message in the browser. An error message typically consists of the following components:
- Error type: Indicates the general class of error. In this example below this is a
ReferenceError. - Description: Provides a more specific explanation of what triggered the error. In this case, 'right_leter is not defined'.
- Source: Specifies the item that triggered the error and whether it occurred during the Run or Prepare phase.
- Source script: The JavaScript code that caused the error. This information is only shown if the error occurred while evaluating custom JavaScript, which includes inline_javascript items, but also conditional expressions (e.g. run-if expressions), and text with embedded variable references.
Let's look at an example to better understand these components and learn how to fix a common error:
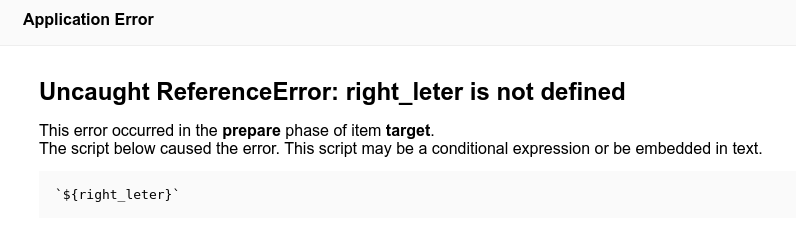
Figure 7. A ReferenceError indicates a reference to a non-existent variable or other non-existent object.
This is a ReferenceError, which indicates that the experiment refers to a non-existent variable or other non-existent object. In this example, the error arose from the text ${right_leter}. Anything enclosed within curly braces and prefixed by a $ is interpreted as JavaScript expression, and in this case, the JavaScript expression is right_leter—which is simply a variable name. Trying to evaluate the JavaScript expression right_leter triggered a ReferenceError because right_leter is not defined.
That's pretty technical, but what exactly went wrong here in simple terms? The issue arises from referring to a non-existent variable: right_leter. Looking at the variable name, it seems likely that there's a typographical error: the intended variable is likely right_letter, with a double 't'.
Where should we correct this mistake? The error message indicates that the source of the error is an item called target, which is a sketchpad. To resolve the error, we need to open target and change the text from '{right_leter}' to '{right_letter}'.
Using the debugger statement in inline_javascript items
The JavaScript debugger statement is a powerful tool for debugging inline_javascript items in OpenSesame/OSWeb experiments. It allows you to insert breakpoints in your code, causing the browser's JavaScript execution to pause at that point. This allows you to inspect the current state of the JavaScript workspace.
Using the debugger statement is straightforward. Simply insert the statement debugger on the line where you want to pause execution. For example:
console.log(`left_letter = ${left_letter}`)
console.log(`right_letter = ${right_letter}`)
debugger // Execution will pause here
Once you've inserted the debugger statement into your code, you need to open the browser console as explained above. After you open the browser console, run your experiment. When the JavaScript interpreter reaches the debugger statement, it will pause execution, and the developer tools will switch to the "Sources" (Chrome/Edge) or "Debugger" (Firefox) tab, highlighting the breakpoint line.
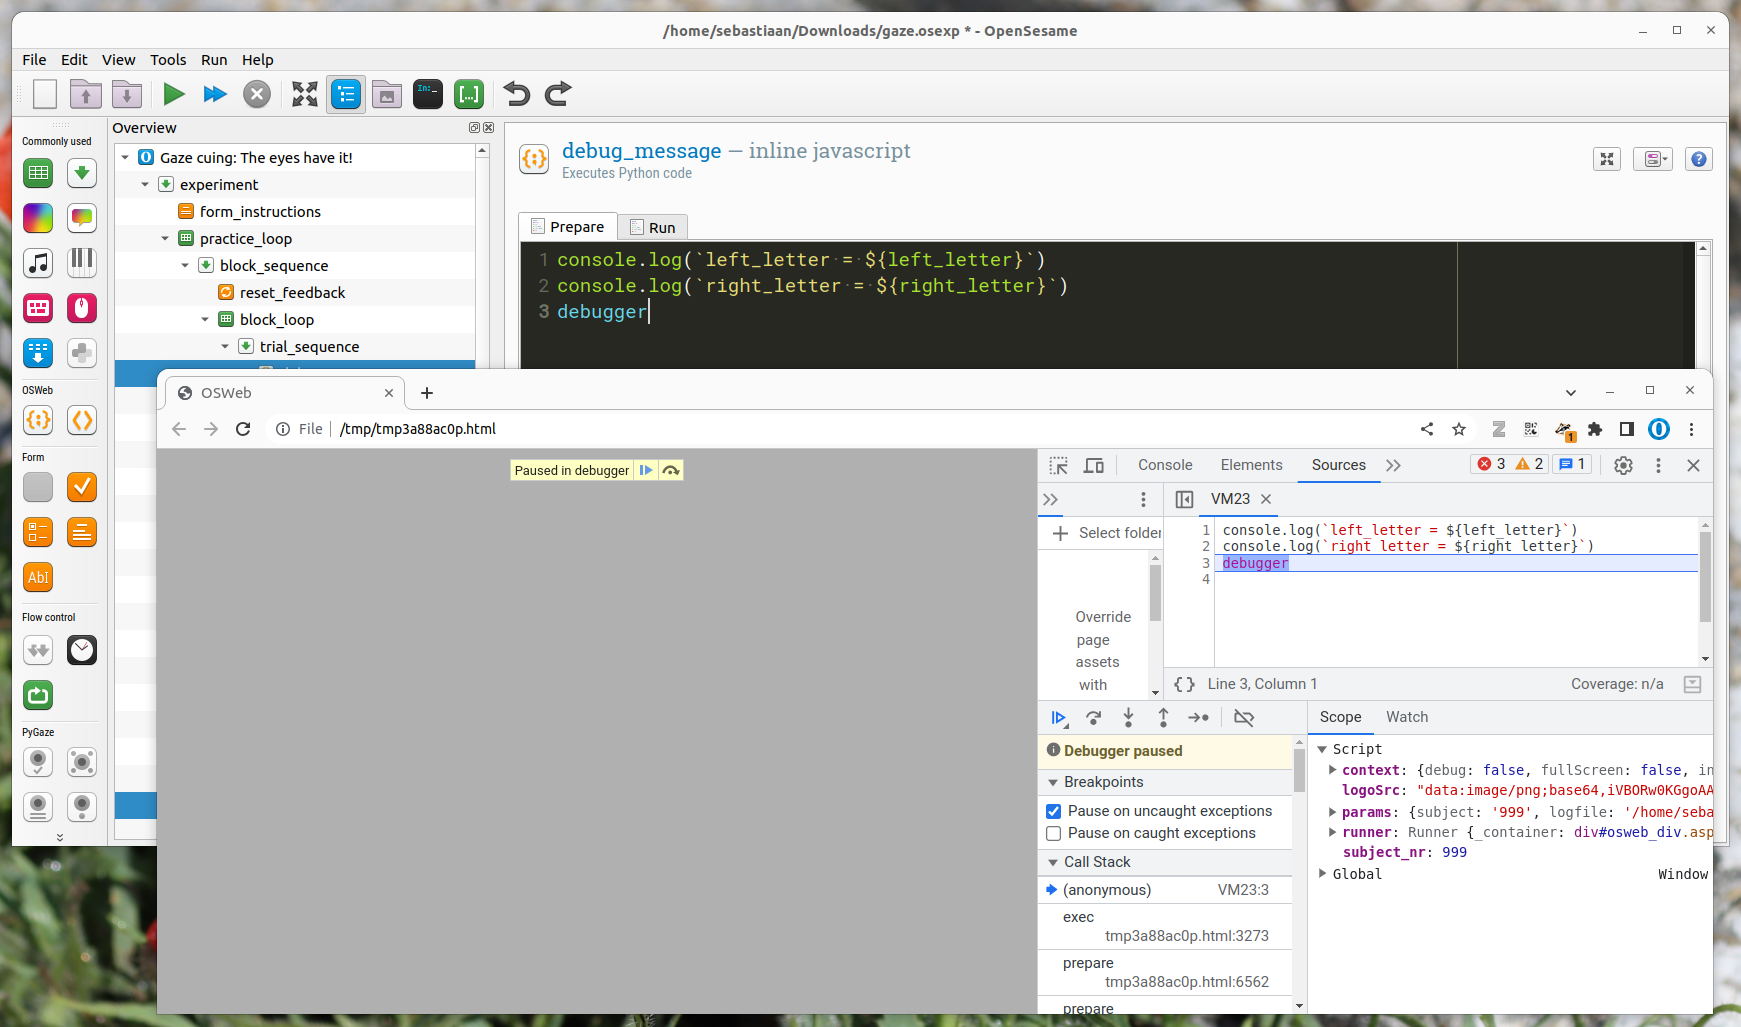
Figure 8. When the JavaScript interpreter reaches the debugger statement, it will pause execution and allow you to inspect the JavaScript workspace. The debugger statement only works when the browser console is open.
While execution is paused, you can inspect variable values, step through the code line by line, and investigate the call stack to better understand the state of your program at the breakpoint.
Remember to remove or comment out the debugger statements when you're finished debugging, as leaving them in can interfere with the normal operation of your experiment.
Handling ExperimentProcessDied errors
Occasionally, you might encounter an ExperimentProcessDied error during an experiment.
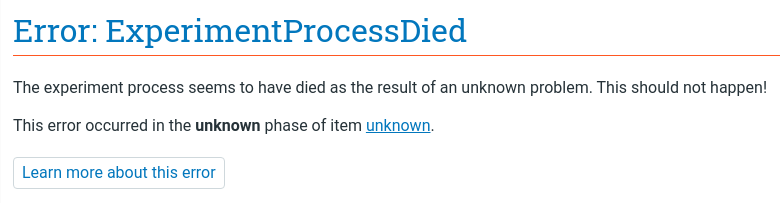
Figure 9. The ExperimentProcessDied error generally indicates an issue with the underlying Python process or associated libraries, not your experiment's code.
This error implies that the Python process in which the experiment was running terminated unexpectedly. It typically doesn't indicate a bug in your experiment, but rather suggests a problem in one of the low-level libraries used by OpenSesame, or even a bug in Python itself.
Determining the exact cause of this error can be challenging, and fixing it may be even more so. However, there are a few workarounds you can try to mitigate the issue:
- Change the backend: Select a different backend under 'Run Experiment' in the experiment properties. This might resolve the issue as different backends use different sets of low-level libraries.
- Update OpenSesame and relevant packages: Regularly updating OpenSesame and all associated packages can potentially resolve this issue, as bugs are routinely fixed in new versions.